The Longhorn dashboard serves as monitoring for the Longhorn storage system, and in this article I will go into details to explain its features, as it can be confusing at times.
We are using Longhorn in many on-premise Kubernetes clusters as the default block storage system. Basically, it is that part which allows you to have a storage class and create PersistentVolumeClaims / PersistentVolumes in Kubernetes.
Longhorn has many advantages:
It also has a web dashboard, the topic I will discuss here. I will assume you already know how to access it if you use Longhorn.
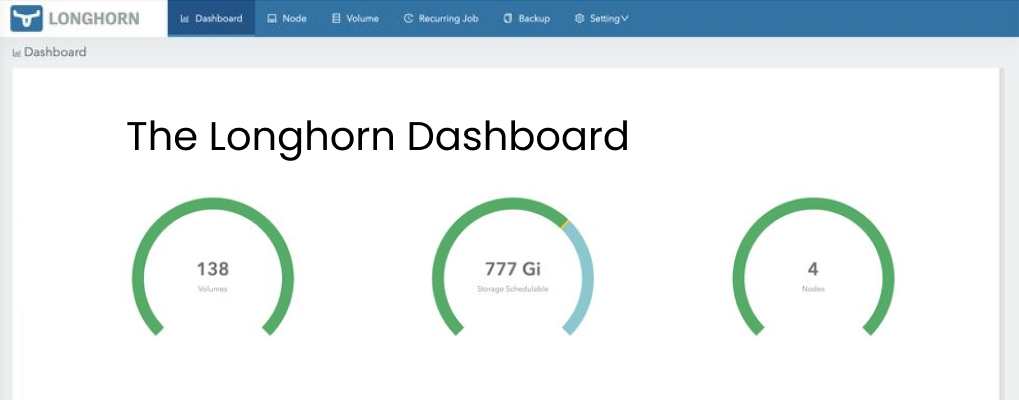
This is a screenshot from one of our clusters:
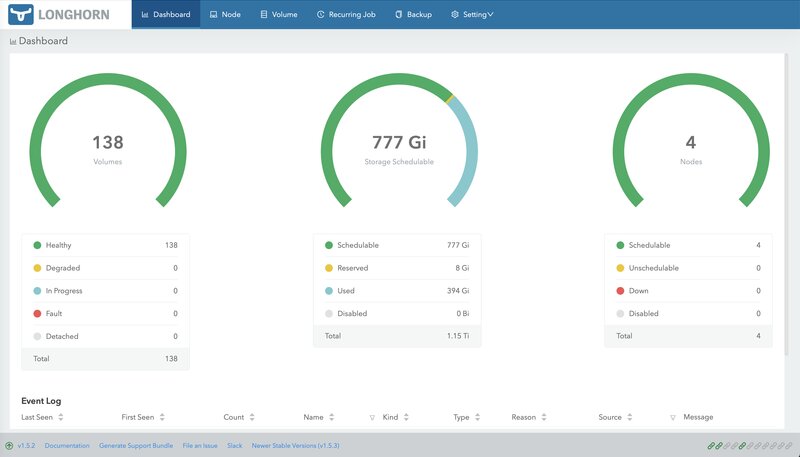
It looks like we are in great shape, the circle in the middle shows we have more than half of the disk space schedulable, less than half used.
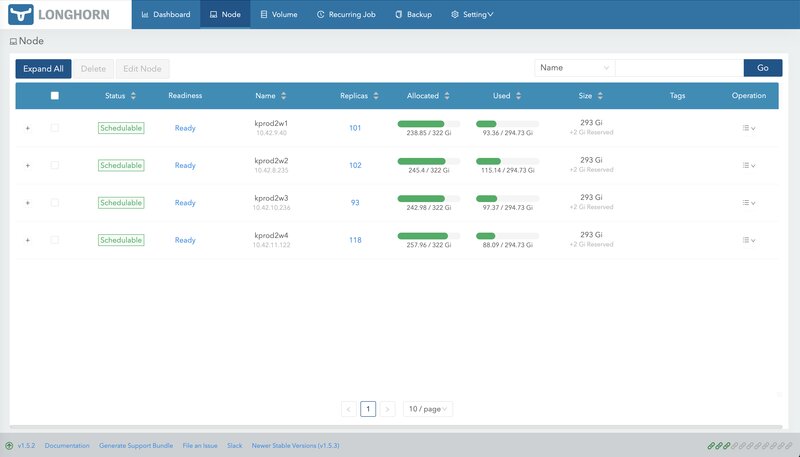
But the story is not complete, click on the Node tab and you see:

In the column Allocated you see about 75% is used on every node. In the column Used, about 30-40% used on every node. Um, what? I'm confused, do we have enough storage or not?
The dashboard is explained in the official documentation, but who has time for that...

So, let me present a short version here.
The first dashboard page is useful as a general view and more oriented on the health of the system. Do not trust the green middle circle with storage schedulable.
Consult the Node page for disk space, read the columns from right to left:
Column Size - that is exactly what storage you have on the node (total disk space of the node minus reserved space). For details, click on column Operation on the three lines menu on each node to Edit node and disks.
Column Used X/Y - X is exactly how much storage is used inside volumes. For example, you may create a 10GB PVC/PV and store only 1GB files inside it. Second number in this column is total space on the node (reserved space included).
Column Allocated Z/T - Z is the sum of sum allocated disk space by volumes, the storage: part in PVC definition:
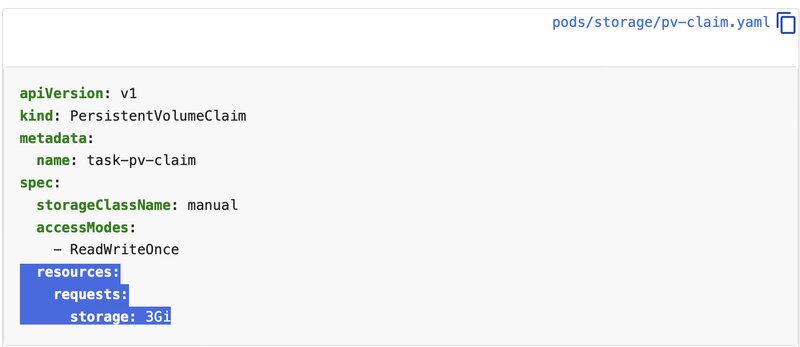
The second number in Allocated is the max size for volume scheduling, or Size multiplied with Storage Over Provisioning Percentage.
Yeees, Longhorn can do over-provisioning. And this is exactly for the situation when you create big PVC/PV but use little disk space inside them.
So, let's see again the last screenshot and decipher all the numbers:
So, in conclusion, we are at about 75% usage, not under 50% as you may be mislead by the first screeshot. Not great, not terrible!
That's all, HTH.
If you wish the read the original article, check it out on github.
You can also check out my speech at Big Data Week on on-premise k8s storage options here.

Viorel Anghel has 20+ years of experience as an IT Professional, taking on various roles, such as Systems Architect, Sysadmin, Network Engineer, SRE, DevOps, and Tech Lead. He has a background in Unix/Linux systems administration, high availability, scalability, change, and config management. Also, Viorel is a RedHat Certified Engineer and AWS Certified Solutions Architect, working with Docker, Kubernetes, Xen, AWS, GCP, Cassandra, Kafka, and many other technologies. He is the Head of Cloud and Infrastructure at eSolutions.